Verified Financial & Operational Outcomes
Measured across US, UK & European mid-market client engagementsWarehouse Labor Cost Reduction
Restructured $157M annual budget and automated warehouse shift allocations.
Clearance Sales Revenue Lift
Eliminated slow stock using machine learning demand models & dynamic pricing.
Automated Cash Flow Visibility
Consolidated Twint, SumUp, Stripe & cash from 4-day lag to under 5 minutes.
“It was extraordinary to see such a rapid increase in our EBITDA, thanks to operational optimization and the daily visibility into our performance that we now have. We commend them for their professionalism and dedication.”

Víctor Abreu M
General Manager, Atal Caribe SRL
Three Core Pillars. Zero Technical Dilution.
We are not a generalist web shop or an IT repair agency. We engineer the automated business intelligence systems, financial models, and operational pipelines that expand your EBITDA and protect your working capital.
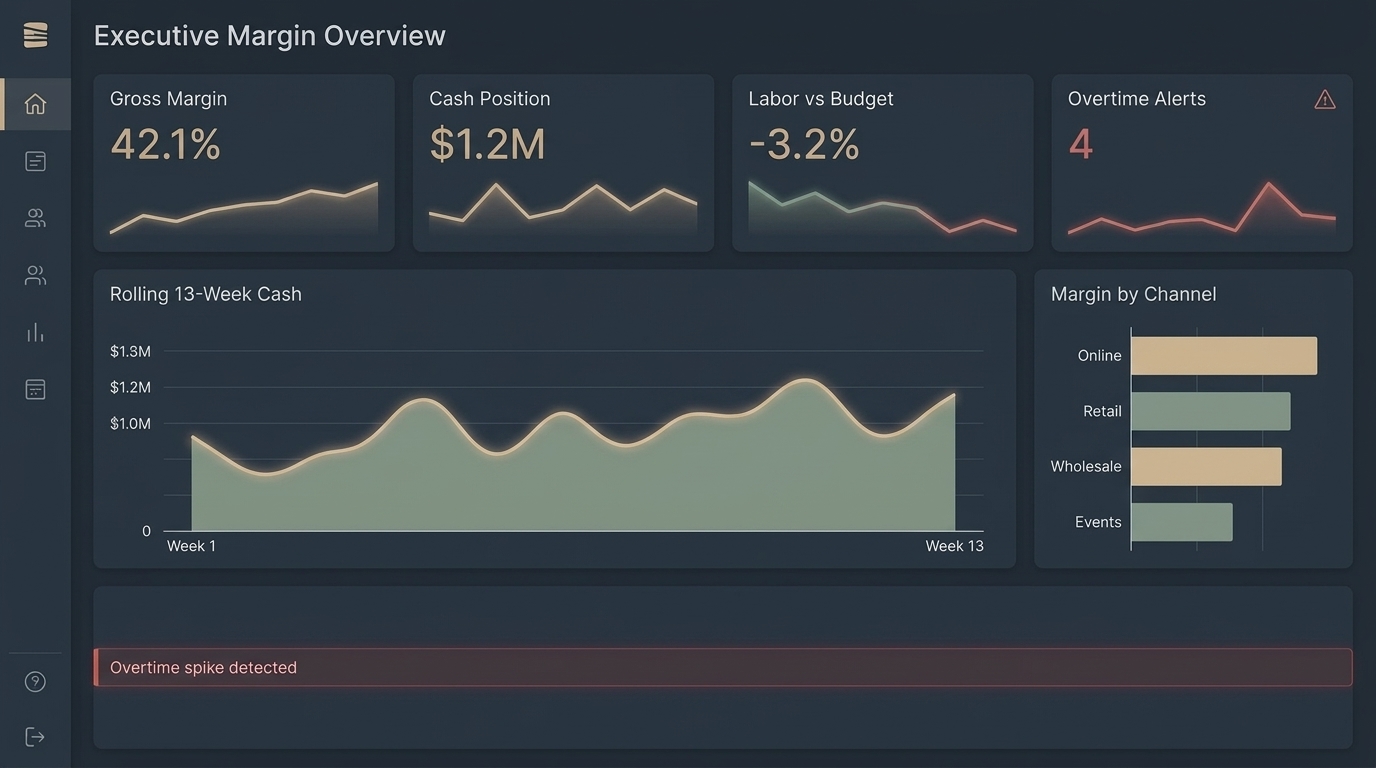
Margin & Performance Dashboards
Single Source of Truth for Real-Time Executive Decision-Making
Your leadership team spends the first 10 days of every month arguing over whose spreadsheet is accurate while margin leaks compound quietly in the background.
100% visibility into where margin is won or lost every morning by 8:00 AM.
Automated FP&A & Cash Flow Modeling
Dynamic Liquidity Forecasting and Payment Channel Consolidation
Decisions on hiring, equipment capex, and purchasing are made on rear-view bank balances rather than rolling 13-week forward liquidity models.
Eliminate month-end accounting surprises; slash financial consolidation time by up to 80%.
Operational AI & Process Automation
Eliminate 15+ Hours/Week of Administrative and Spreadsheet Drudgery
Your highest-paid operations managers spend 40% of their week copying data between incompatible platforms, reconciling invoices, and generating status reports.
30–50% reduction in back-office operational overhead without expanding IT headcount.
Supporting Layer: Executive Portals & Custom Analytics Infrastructure
Need a secure, authenticated web portal for multi-unit store managers, franchise operators, or vendors? We engineer blazing-fast custom hubs integrated directly with your data warehouse.
Where Do You Stand Right Now?
Most growing businesses reach an inflection point between $3M and $20M in revenue where spreadsheets transition from a helpful tool into a dangerous liability.
The Spreadsheet Trap
Where 3% to 7% of net margin quietly leaks every quarter
Decentralized Excel files with broken formulas, `#REF!` errors, and multiple version conflicts
Month-end closes take 10–14 days, forcing executive decisions to rely on obsolete data
High-salary managers spend 15+ hours a week manually copy-pasting numbers across tools
Single-point-of-failure risk: only one key employee understands how the financial models work
Margin blind spots: impossible to tell which specific SKUs, shifts, or locations are draining EBITDA
The Single Source of Truth
Engineered by Your Analytical Partner in 14–21 business days
Automated, unified dashboards running directly off your live ERP, POS, and accounting data
Daily 8:00 AM executive digest: real-time gross margin, cash position, and operational throughput
Zero manual data entry: automated pipelines reconcile bank, card, and floor records 24/7
Enterprise-grade governance: institutional ownership of models with full documentation & cloud backup
Precision profitability: instant clarity on true contribution margins to scale what works and cut leaks
Case Study Field Reports
Strictly structured: Problem → Implemented System → Measured Business Impact. No vanity metrics.
How a Global Produce Company Cut Labor Costs by 36%
Restructuring a sprawling $157M budget and automating warehouse operations.
A global leader in agricultural produce was managing a decentralized multi-warehouse network across regions using manual spreadsheets. With a $157M operating budget, executive teams lacked shift-level labor visibility, leading to rampant overtime costs and delayed monthly closes.
Designed and deployed custom Power BI operational dashboards integrated with SAP, Excel, and warehouse floor records. Built automated shift allocation models and transitioned outsourced accounting workflows into an in-house automated ERP infrastructure.
Slashed warehouse labor expenses by 36%, drove a 25% reduction in overall G&A overhead, and eliminated high six-figure recurring fees from outsourced accounting consultancies.
Daily Financial Clarity: A Zürich Bar's Story
Consolidating multiple payment platforms (Twint, SumUp) into an automated tracker.
An independent high-volume bar and lounge in Zürich accepted transactions across Twint, SumUp, and cash. Compiling statements required 3–4 full days at month-end. Category margins drifted unchecked, and cash flow decisions were made purely on intuition.
Engineered an automated multi-channel financial consolidation pipeline that ingests and reconciles all payment channels daily. Built a live KPI dashboard tracking category-level COGS % (beer, wine, cocktails, food) with automated cash flow forecast variance warnings.
Reduced month-end reporting time from 4 days to under 5 minutes, gave ownership daily cash flow visibility, and enabled real-time menu pricing adjustments that stabilized seasonal margins.
How a Beauty Brand Increased Clearance Revenue by 170%
Predictive machine learning demand models and dynamic pricing execution.
A leading cosmetics retailer had over $1M tied up in slow-moving inventory across regional warehouses. Manual spreadsheet forecasting caused frequent stockouts of top sellers while dead stock sat on shelves for months without a structured clearance strategy.
Built a machine learning-driven inventory forecasting engine in SQL and Python. Created a dynamic clearance pricing algorithm that altered promotional markdown schedules based on sales velocity and automated CRM re-engagement campaigns.
Generated a 170% surge in clearance sales revenue without cannibalizing flagship product lines, lifted customer retention by 32%, and unlocked significant working capital within 90 days.
Live in 21 Days. Zero IT Disruption.
We don’t subject your business to a 9-month enterprise IT overhaul. We operate in surgical, fixed-scope sprints that produce measurable clarity before your next monthly close.
45-Min Systems Audit & Data Ingestion
We map your existing software (ERP, POS, Excel, accounting) and obtain secure, read-only data connections. Zero software replacements, zero downtime for your team.
Rapid Sprint Build & Sandbox Testing
Our senior partners personally build your automated data pipelines, contribution margin models, and executive dashboards in our secure sandbox, validated with your actual numbers.
Executive Handover & Ongoing Clarity
We train your key leaders in 60 minutes, deploy your live daily 8:00 AM dashboards, and transition you into ongoing fractional performance analytics with zero hostage contracts.
The 2026 SME Cash Flow & Margin Health Scorecard
Not ready to schedule a call? Run this 10-minute self-audit used by CFOs and Managing Directors to uncover silent operational profit leaks.
Silent Inventory Carrying Drag: Identify aging SKUs quietly draining your working capital
Phantom Shift Overtime Score: Expose where warehouse or floor labor scheduling breaks down
Payment Channel Fee Drift: Audit hidden merchant, POS, and gateway deductions
The 13-Week Cash Blind Spot: Benchmark your forward liquidity forecasting maturity
Spreadsheet Fragility Index: Score your operational risk of key-person Excel dependency
Built by Enterprise Operators. Deployed with SME Speed.
We don’t hand your company off to junior contractors or account reps. You partner directly with former corporate finance, data engineering, and growth strategists.

Marlene Blandino
Head of Operations & Analytics
Brings over a decade of hands-on experience restructuring multi-million dollar operating budgets, designing automated margin-control frameworks, and integrating complex ERP systems for enterprise leaders including Hortifrut and Belcorp. At Your Analytical Partner, she personally architects the KPI engines and contribution margin models that protect client EBITDA.

Santiago Abisambra
Head of Data Architecture & Engineering
Specializes in transforming chaotic operational databases into rock-solid single sources of truth. Santiago designs enterprise-grade data warehouses, resilient API ingestion pipelines, and automated reporting hubs that run 24/7 without manual intervention. He has built mission-critical pipelines for high-volume retail, distribution, and finance networks.

Sarbik Banerjea
Head of AI & Growth
Leads AI automations and client growth, working directly with SME founders, CEOs, and CFOs across the US, UK, and European markets to translate complex operational records into bottom-line financial expansion. Sarbik ensures every analytics initiative targets high-leverage bottlenecks with rapid payback cycles (typically under 60 to 90 days).
Direct Answers for Pragmatic Operators
Everything you need to know about our data architecture, time commitments, and sprint guarantees.
Ready to See Exactly Where Your Margins Are Leaking?
Book a 15-Minute Operational Margin Diagnostic. We’ll review your data setup, identify your 2 largest operational blind spots, and hand you a 1-page Margin Architecture Map—yours to keep whether we work together or not.